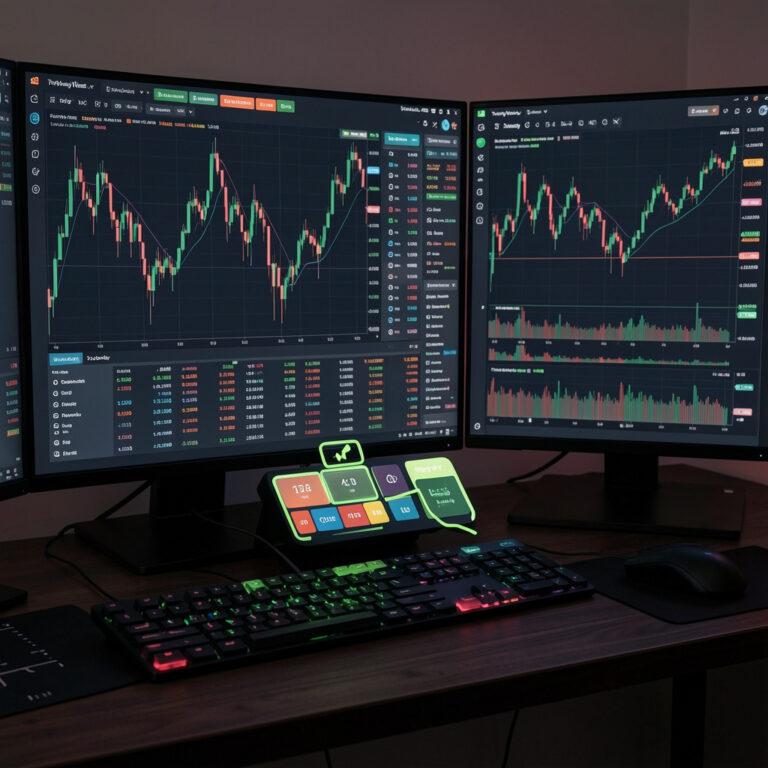
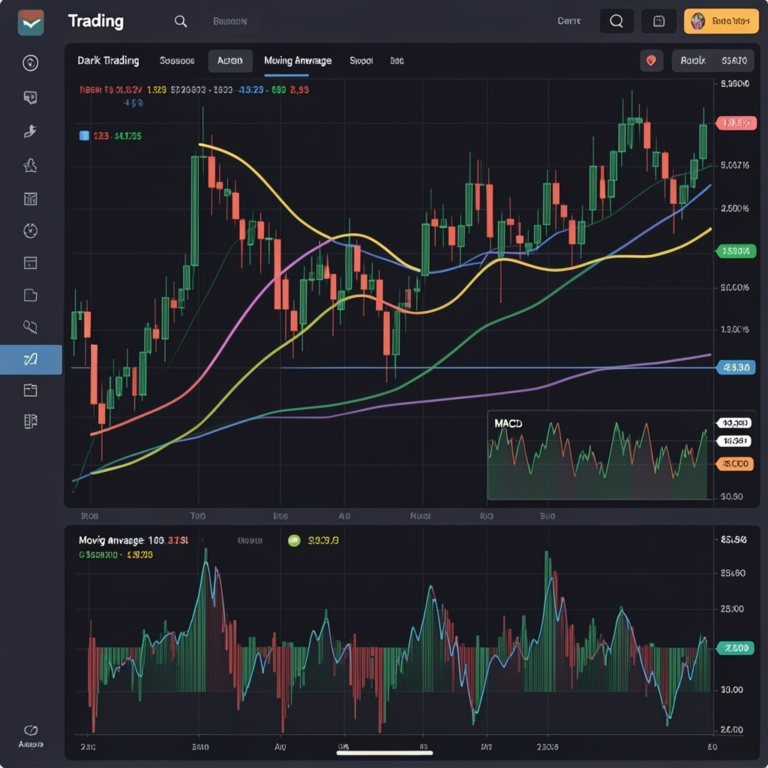
You set up a TradingView chart by selecting the timeframe, chart type, and trading symbol — these three elements control data precision and signal clarity.
TradingView supports stocks, forex, and crypto within one unified interface, so the same charting workflow applies across every market you trade.
Element
Function
Example
Timeframe
Defines detail level
1H for intraday
Chart Type
Displays price data
Candlestick
Symbol
Identifies asset
BTC/USDT
What Tools Does TradingView Offer for Technical Analysis?
TradingView offers indicators, drawing tools, and chart pattern recognition, letting you analyze price action directly on the chart.
These indicators operate directly on candlestick charts and update in real time.
What Drawing Tools Does TradingView Provide?
TradingView provides drawing tools to mark price structures and patterns.
Drawing Tools
Trendlines — define support and resistance zones
Horizontal rays — highlight key price levels
Channels — track parallel price movement
Text labels — annotate trade setups
Which Indicators Do You Use in TradingView?
You use indicators to quantify price action and market conditions. TradingView provides both built-in and custom indicators.
Indicator
Purpose
Moving Average
Defines trend direction
RSI
Measures overbought/oversold levels
MACD
Detects momentum shifts
Volume
Confirms price strength
Combining several indicators improves signal reliability compared to relying on just one.
How Do You Use TradingView for Different Markets?
TradingView supports stocks, forex, and cryptocurrencies. You access market-specific data, apply indicators, and analyze price behavior within a unified chart interface.
Stock Market
You track listed companies and analyze price-volume behavior using tickers like RELIANCE or TCS, with daily and weekly timeframes revealing trend and volume-driven movement.
Forex Trading
You analyze currency pairs such as EUR/USD and GBP/JPY, watching pip-based movement while RSI and MACD confirm trend strength and direction.
Cryptocurrency Trading
You connect exchange data such as Binance to track pairs like BTC/USDT and ETH/USDT, monitoring 24/7 activity and volatility spikes for breakout patterns.
How Do You Identify Chart Patterns in TradingView?
You identify chart patterns by recognizing repeating price structures that signal continuation or reversal.
Pattern
Signal
Head and Shoulders
Trend reversal
Double Top / Double Bottom
Resistance or support break
Triangle
Consolidation and breakout
How Do You Use Pine Script in TradingView?
You use Pine Script to build custom indicators and automated strategies. TradingView executes scripts and supports backtesting directly on the chart.
1
Write code in the Pine Editor
Build your custom logic using Pine Script syntax.
2
Define entry and exit rules
Set exact conditions for your strategy.
3
Run historical simulations
Test the script against past price data.
How Do You Perform Backtesting in TradingView?
You perform backtesting by running strategies on historical price data and reviewing performance metrics.
Metric
Meaning
Win Rate
Percentage of winning trades
Drawdown
Maximum capital loss
Net Profit
Total strategy return
TradingView vs MetaTrader 4 vs MetaTrader 5
TradingView provides superior charting and accessibility, while MetaTrader focuses on execution and automation.
Feature
TradingView
MetaTrader 4
MetaTrader 5
Charting
Advanced
Moderate
Advanced
Assets
Multi-asset
Forex-focused
Multi-asset
Scripting
Pine Script
MQL4
MQL5
Backtesting
Built-in
Limited
Advanced
Best of BothMany traders combine both platforms — TradingView for analysis and idea generation, MetaTrader for execution.
How to Start Using TradingView Step-by-Step
1
Create an account
Sign up on TradingView’s website or app.
2
Select an asset
Choose a stock, forex pair, or cryptocurrency.
3
Open the chart and apply indicators
Add the indicators relevant to your strategy.
4
Draw support and resistance levels
Mark key zones directly on the chart.
5
Set alerts and test strategies
Automate notifications and validate your approach.
What Are the Best TradingView Features for Traders?
TradingView delivers cloud-based charting, cross-device access, and social collaboration tools.
Cloud & Sync Benefits
Chart layouts save automatically — no local storage required
Data retrieves consistently across sessions
Layouts and indicators sync instantly between desktop and mobile
Social features let users publish trade ideas, comment, and review setups, so you can compare strategies and refine your own decisions.
How Do You Build Trading Strategies With TradingView?
You build trading strategies by combining indicators, chart patterns, and risk management rules.
Example Framework
Define entry — e.g. RSI below 30
Define exit — e.g. RSI above 70
Set a stop-loss and take-profit level
Example applications include a crypto breakout strategy on Binance data, or a forex trend-following approach using moving averages.
Frequently Asked Questions
Select your timeframe, chart type (usually candlestick), and search for your trading symbol — these three settings define how the chart displays price data.
Moving averages, RSI, and MACD are the most widely used starting indicators, and combining them improves signal reliability.
Yes. TradingView supports all three markets within one unified interface, connecting to exchanges like Binance for crypto and covering major stock and forex tickers.
Pine Script lets you build custom indicators and automated strategies, which you can then backtest against historical price data directly in TradingView.
TradingView offers stronger charting, Pine Script, and cloud-based access, while MetaTrader focuses on execution and automation — many traders use both together.